Basic Attention Token (BAT) Price Prediction – July 5
There have been indications suggesting the BAT market activity attempts to swing high against the US economy. In the last 52 weeks of trading, the price has experienced a low of $0.2608 and a high of $1.92.
Basic Attention Token (BAT) Price Statistics:
BAT price now – $0.4224
BAT market cap – $631.5 million
BAT circulating supply – 1.498 billion
BAT total supply – 1.5 billion
Coinmarketcap ranking – #69
Basic Attention Token (BAT) Market
Key Levels:
Resistance levels: $0.50, $0.60, $0.70
Support levels: $0.30, $0.25, $0.20 BAT/USD – Daily Chart
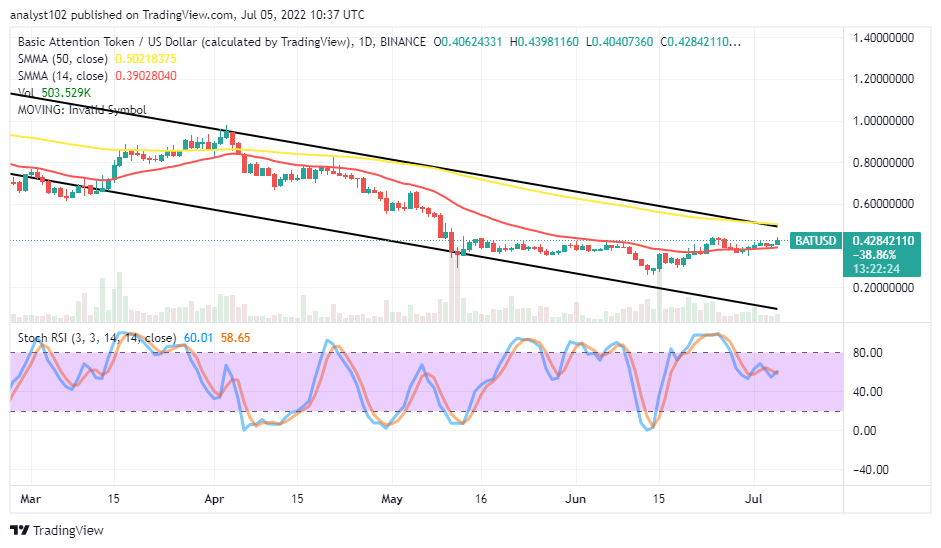
The daily chart showcases Basic Attention Token market operation attempts to swing high as it trades pairing with the US Dollar on the buy signal side of the smaller SMA. The 14-day SMA indicator is underneath the 50-day SMA indicator. The Stochastic Oscillators have initially moved southbound out of the overbought region, trying to oscillate around the 60 range. Variant smaller bullish candlesticks have featured to affirm a buying force is ongoing.
Will there be sustainable ups in the BAT/USD market operations?
There has been a promising buying force in the BAT/USD market operations as the crypto economy attempts to swing high presently. Long-position takers should not over-leverage their orders. In other words, a smaller lot size is technically ideal. A sudden reversal movement from above of the 14-day SMA trend line purposely to breach it southward will negate the possibility of sustainable ups on a long-term outlook.
On the downside of the technical analysis, the BAT/USD market short-position takers may have to wait for the trade reactions around the trend line of the 50-day SMA before considering a new sell order. An aggressively breaching process around the indicator to the upside will nudge the trading zone into a higher spot to set for more recovery of momentums afterward.
BAT/BTC Price Analysis
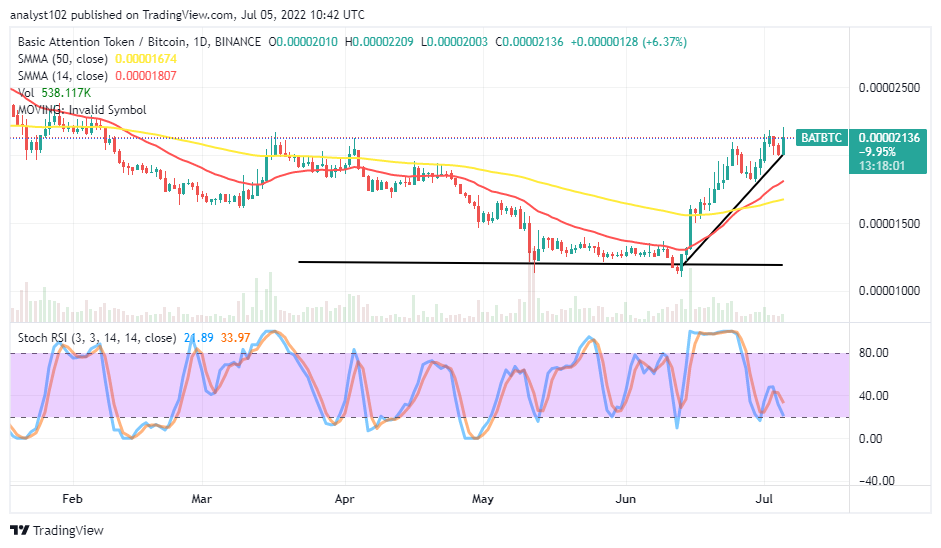
Basic Attention Token has continued to push higher than the previous days’ sessions against the trending force of Bitcoin. The cryptocurrency pair market attempts to swing high above its SMA trading indicators. The 14-day SMA has intercepted the 50-day SMA to the north side. The Stochastic Oscillators are in the ranges of 40 and 20. The current candlestick features bullish to denote the situation controlled by buyers at the expense of the bears’ weaknesses as of writing.
eToro – Automated Copytrading of Profitable Traders
- 83.7% Average Annual Returns with CopyTrader™ feature
- Review Traders’ Performance, choose from 1 – 100 to Copytrade
- No Management Fees
- Free Demo Account
- Social Media & Forum Community – Trusted by Millions of Users
Read more:


