Polkadot Price Prediction – August 30
A gradual change has been made in the declining pace of the DOT/USD market operations as the crypto looks for support at a lower-trading spot against the US fiat coin. Yesterday’s session recorded a low of $6.83 and a high of $7.29, with a percentage change of 6.40 positive.
Polkadot (DOT) Statistics:
DOT price now – $7.21
DOT market cap – $8 billion
DOT circulating supply – 1.1 billion
DOT total supply – 1.3 billion
Coinmarketcap ranking – #11
DOT/USD Market
Key Levels:
Resistance levels: $10, $12, $14
Support levels: $5, $4, $3 DOT/USD – Daily Chart
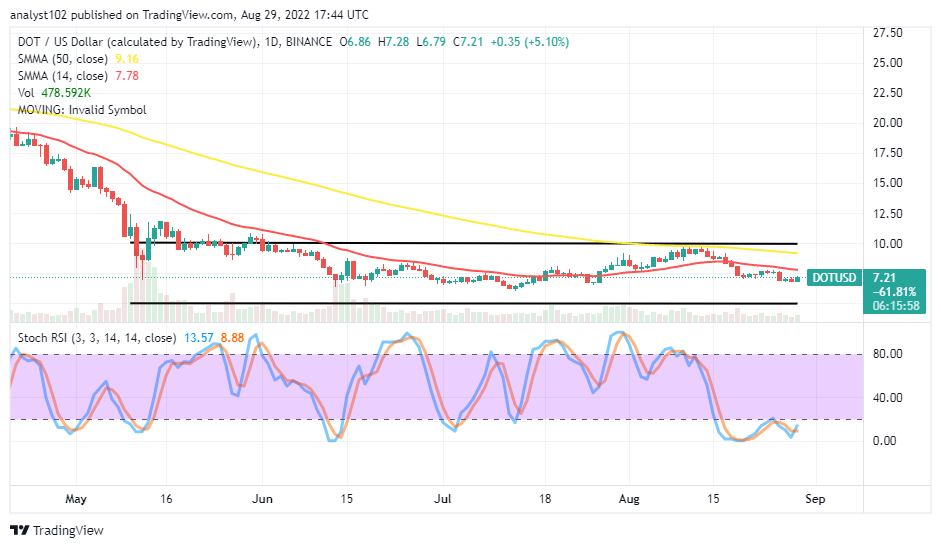
The daily chart depicts Polkadot looking for support underneath the trend lines of the SMAs, trading against the US Dollar. The 50-day SMA indicator is at 9.16 above the $7.78 value line of the 14-day SMA indicator. The upper and the lower range lines drew to give range-bound zones characterized by $10, $7.50, and $5 value lines. The Stochastic Oscillators are in the oversold region, showing they are at13.57 and 8.88 range values.
Your capital is at risk.
Will the DOT/USD market keep long further under depression afterward?
For the DOT/USD market operation to hold long under a depression-trading condition at its current price, buyers’ reaction will have to be recessive for a long time as the crypto is looking for support below the trend line of the 14-day SMA. In the meantime, the space between the smaller SMA indicator and the lower range line drawn will serve as the zone where variant upswings will surface in no time. Therefore, long-position takers need to take notes to derive an advantage in the process.
On the downside of the technical analysis, the current gravitational force depicted by the reading of the Stochastic Oscillators tends to carry lowly low-active motions to back most of the possible downs that can surface in the DOT/USD trade. Based on that analytics sentiment, shorting of orders are to suspend for a while until another round of rejections or reversal pattern form at a high resistance-trading spot afterward.
DOT/BTC Price Analysis
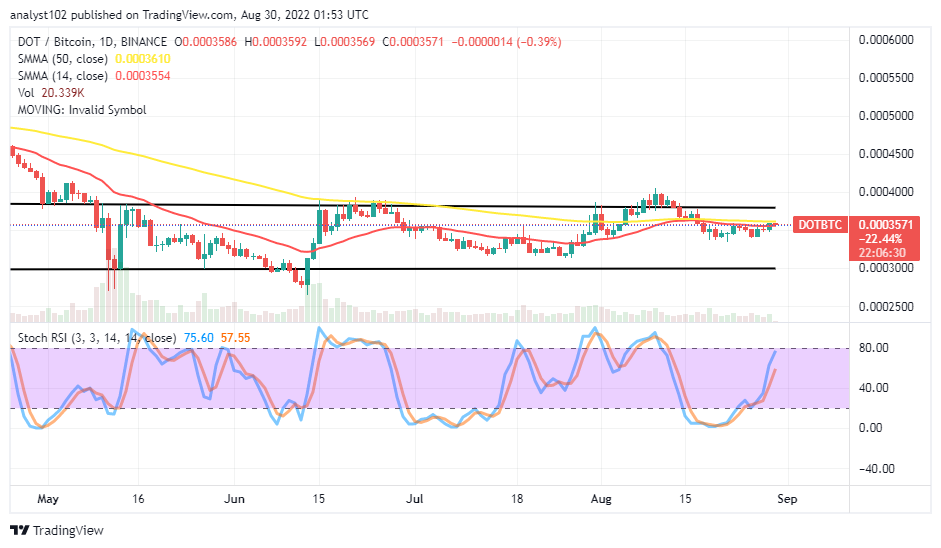
Polkadot is around the upper range zone against the trending capacity of Bitcoin. The cryptocurrency pair price has been looking for support closely underneath the trend lines of the SMAs. The 14-day SMA indicator is tightly below the 50-day SMA indicator. And they are pointing eastward to denote a ranging move is in place to an extent. The Stochastic Oscillators have swerved northbound from the 20 range to 57.55 and 75.60 range values. That somewhat portends the base crypto is fast approaching its exhaustion, trending northward against the counter crypto.
Tamadoge – Play to Earn Meme Coin
- Earn TAMA in Battles With Doge Pets
- Capped Supply of 2 Bn, Token Burn
- NFT-Based Metaverse Game
- Presale Live Now – tamadoge.io
Read more:


