Crypto markets have historically been cyclical based on Bitcoin halving events. Bitcoin halvings happen every time 210,000 blocks are mined — roughly every four years. The last halvings occurred in 2012, 2016, and 2020.
Between each halving, a bull market has been followed by a bear. Given the transparent nature of most blockchain networks, it is possible to review on-chain data to identify patterns and similarities from previous cycles.
CryptoSlate’s research team has reviewed data from Glassnode and identified several potential bear market bottom signals.
Supply P/L Bands
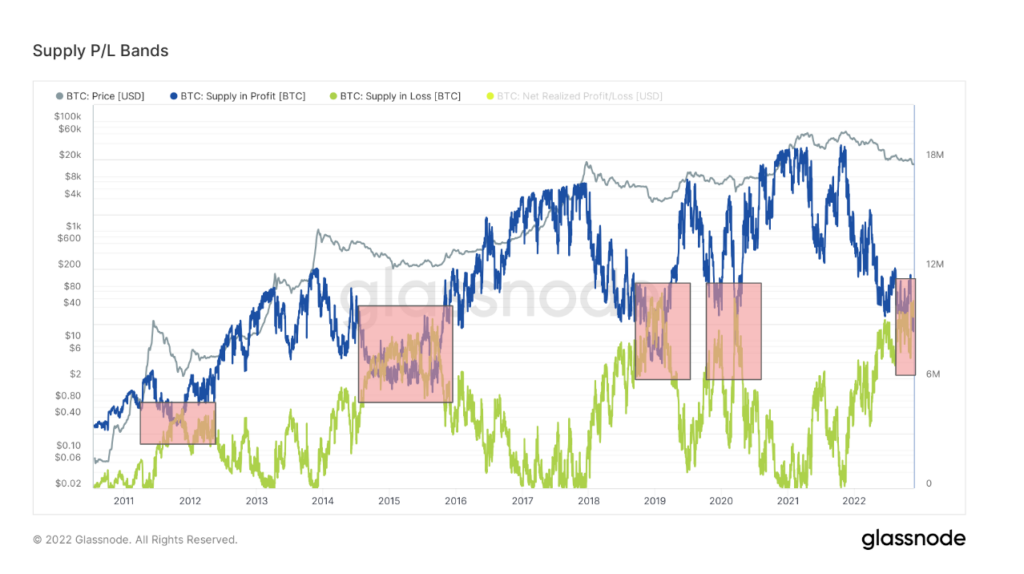
Supply P/L Bands depict the total amount of Bitcoin supply in either profit or loss. The blue line shows the total number of Bitcoin in profit; the green line shows the number currently making a loss.
The values represent unrealized profit and loss as the data tracks the value from the price at the time of the coins’ acquisition through trading or mining.
The blue and green lines have recently converged for the fifth time in Bitcoin’s history. The previous events were during bear markets, close to the cycle’s lowest mark.
The outlier was in May 2020 during the global COVID market crash. Aside from the COVID black swan, the convergence happened in 2012, 2014, and 2019. While the overlaps lasted six months to a year, each time Bitcoin’s price recovered to find a new all-time high within three years.
The Supply P/L Bands are not a guaranteed indicator of bear market bottoms, but while history does not always repeat itself, it often rhymes.

Long-Term & Short-Term MVRV
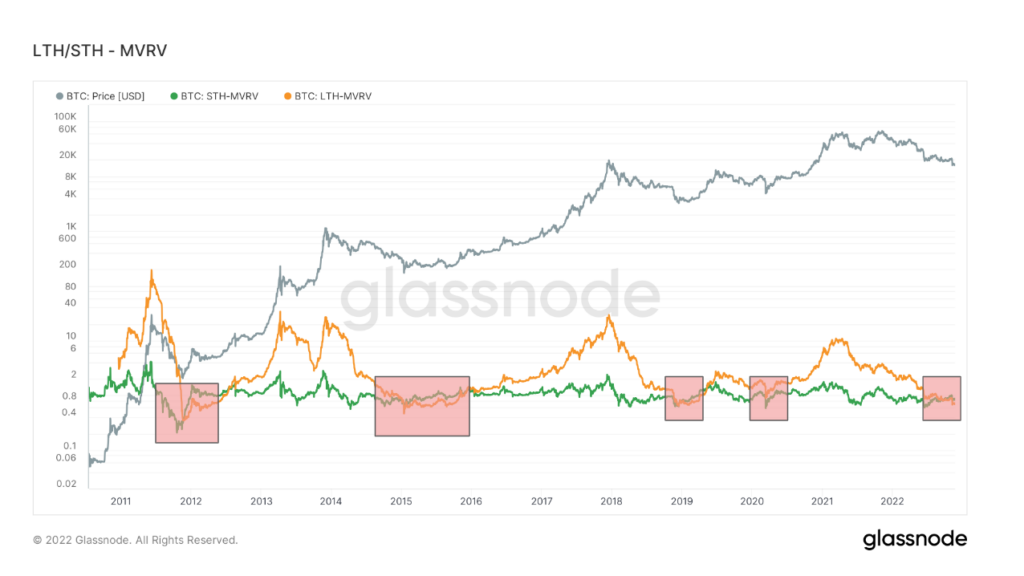
MVRV is a term related to the ratio between the realized and market cap of Bitcoin. MVRV takes into account only UTXOs with a lifespan of at least 155 days and serves as an indicator to assess the behavior of long-term investors.
Similar to the Supply P/L Bands, the MVRV of long-term holders has only dropped lower than short-term holders on five occasions. The periods are almost identical to the supply chart appearing during each of the past bear markets and the COVID crash.

Short-Term Holder Supply
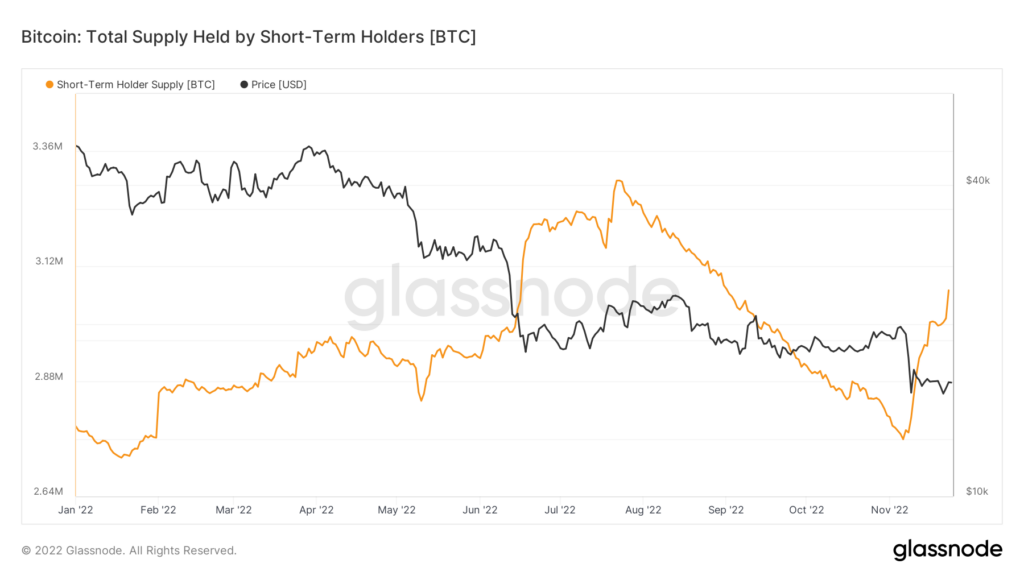
The amount of Bitcoin’s total supply that short-term holders hold has surpassed three million coins from the cycle lows. Short-term holders are often the most sensitive to price volatility, and the number of coins they hold historically bottoms at the base of a cycle.

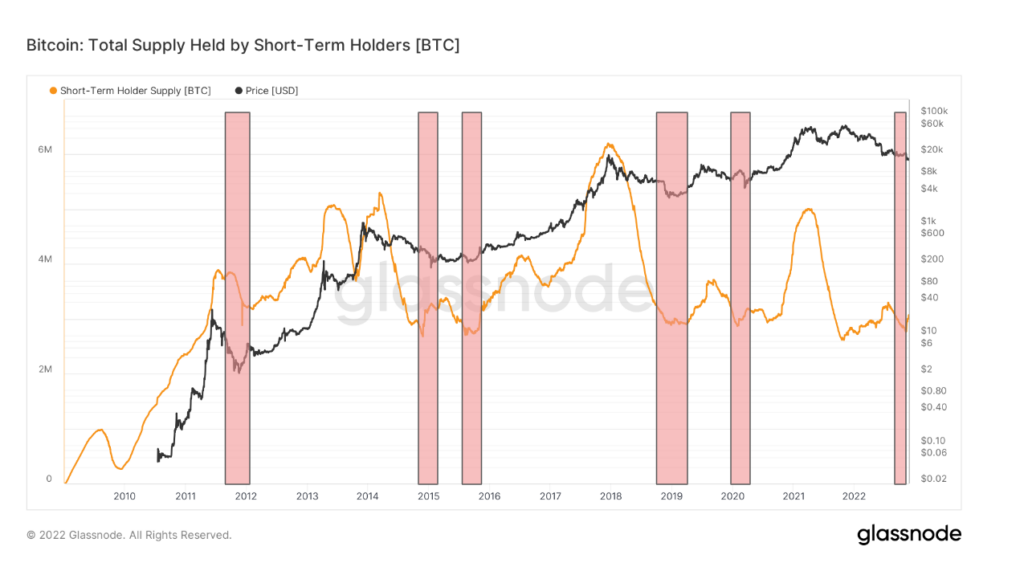
Zooming out showcases the other times when short-term holder supply reached similar levels. However, unlike the other metrics, this phenomenon has presented itself on six occasions since 2011. Four match the other data, while short-term holders bottomed in 2016 and 2021.

One off-chain signal of a bear market bottom has also shown its face in recent weeks. When Bitcoin has fallen from its all-time highs in the past, the point where major publications declare ‘crypto is dead’ has notoriously marked the bottom of the market.
In 2018 Bitcoin was declared dead 90 times by major publications, and 125 times in 2017, according to 99 Bitcoins. Presently, crypto has only received 22 obituaries in 2022, so we’re some way away from this signal, adding weight to the market bottom theory.
Only a fortnight ago Sam Bankman-Fried was in the stratosphere. But the high-speed implosion of FTX has dealt a catastrophic blow to an industry with a history of failure and scandals. Is this the end for crypto? https://t.co/bwynnCeCZ3 pic.twitter.com/NWyqHCZzXm
— The Economist (@TheEconomist) November 17, 2022
The post On-chain data flashes multiple bear market bottom signals appeared first on CryptoSlate.


