Polygon has continued its recent bullish momentum in the past day, jumping a further 6%, as on-chain data shows the whales are highly active currently.
Polygon Is Now Up More Than 21% In The Past Week
The past month has been a great time for Polygon investors as the cryptocurrency has observed a substantial uplift. Earlier in this period, the growth had been slower, but recently the asset has really stepped up.
Here is a chart that shows how MATIC’s rally has looked over the last 30 days:
With the latest leg in the surge, Polygon has reclaimed the $0.80 level for the first time since July of this year. Earlier in the day, the coin had spiked to as high as $0.84, but since then it has registered a pullback towards the current price levels.
Nonetheless, even with the retrace, the asset is up a net 6% during the last 24 hours. As it stands, MATIC’s profits of 21% in the past week are among the best in the sector, with only Chainlink (LINK) showing a better performance inside the top 20 assets by market cap.
It would appear that the whales may be playing a major role in this latest rally if on-chain data is anything to refer to.
Polygon Whale Transaction Count Is At Elevated Levels Currently
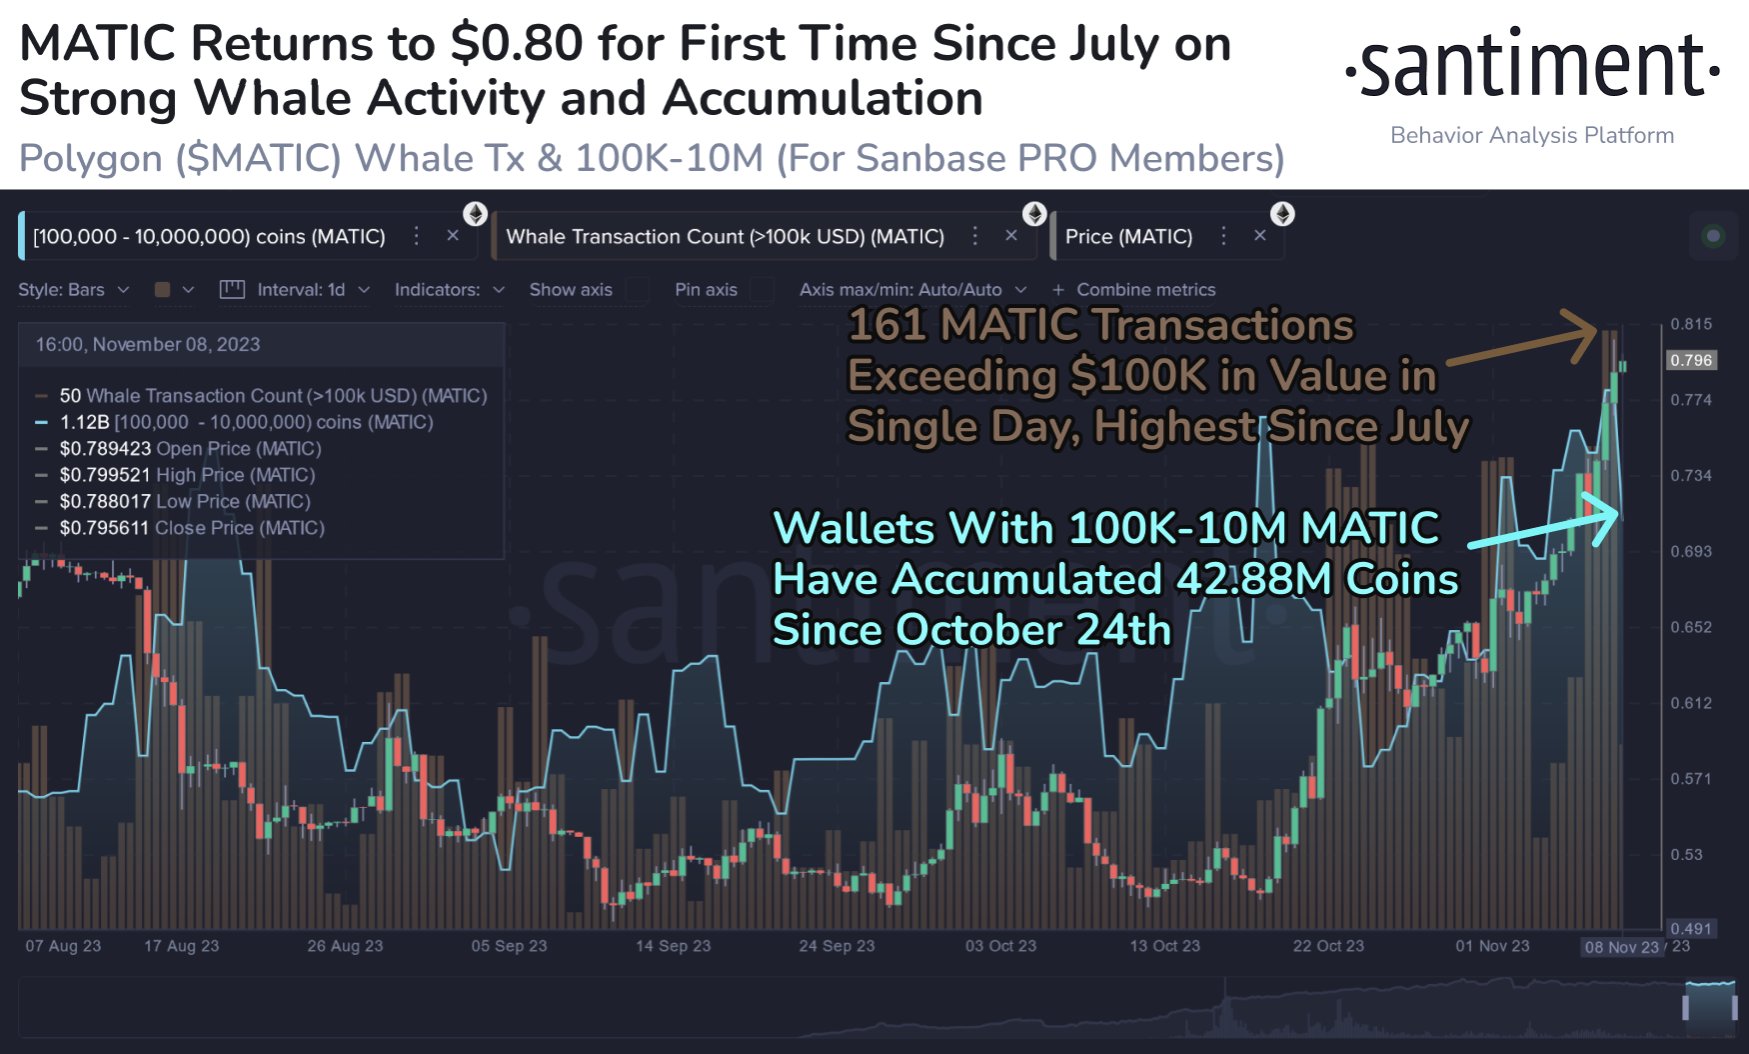
As pointed out by the on-chain analytics firm Santiment, whales have been quite active in the market recently. The relevant indicator here is the “whale transaction count,” which keeps track of the total number of Polygon transactions that are carrying at least $100,000 in value.
The below chart shows the trend in this MATIC metric over the past few months:
As displayed in the above graph, the Polygon whale transaction count has been at high levels recently. To be more particular, the whales have been making more than 161 transactions per day, which is the highest the metric has been since July.
Generally, high activity from the whales can be a predictor of volatility, as a large number of moves of these humongous holders together can have the power to move the market.
Naturally, such volatility can take the cryptocurrency in either direction, as the whale transaction count metric merely tells us about the number of transfers that the whales are making, and not whether these are buying or selling transactions.
In the chart, Santiment has also attached the data for another metric: the combined supply held by the 100,000 to 10 million MATIC addresses. As is visible in the graph, the sharks and whales have been accumulating since 24th October, suggesting that their buying may have been providing support to the rally.
The supply of these key holders may be one to watch for in the coming days, especially given the high transaction activity that the whales in particular are making currently. If the indicator observes a significant drawdown, then it would be a sign that the group has decided to take their profits.


