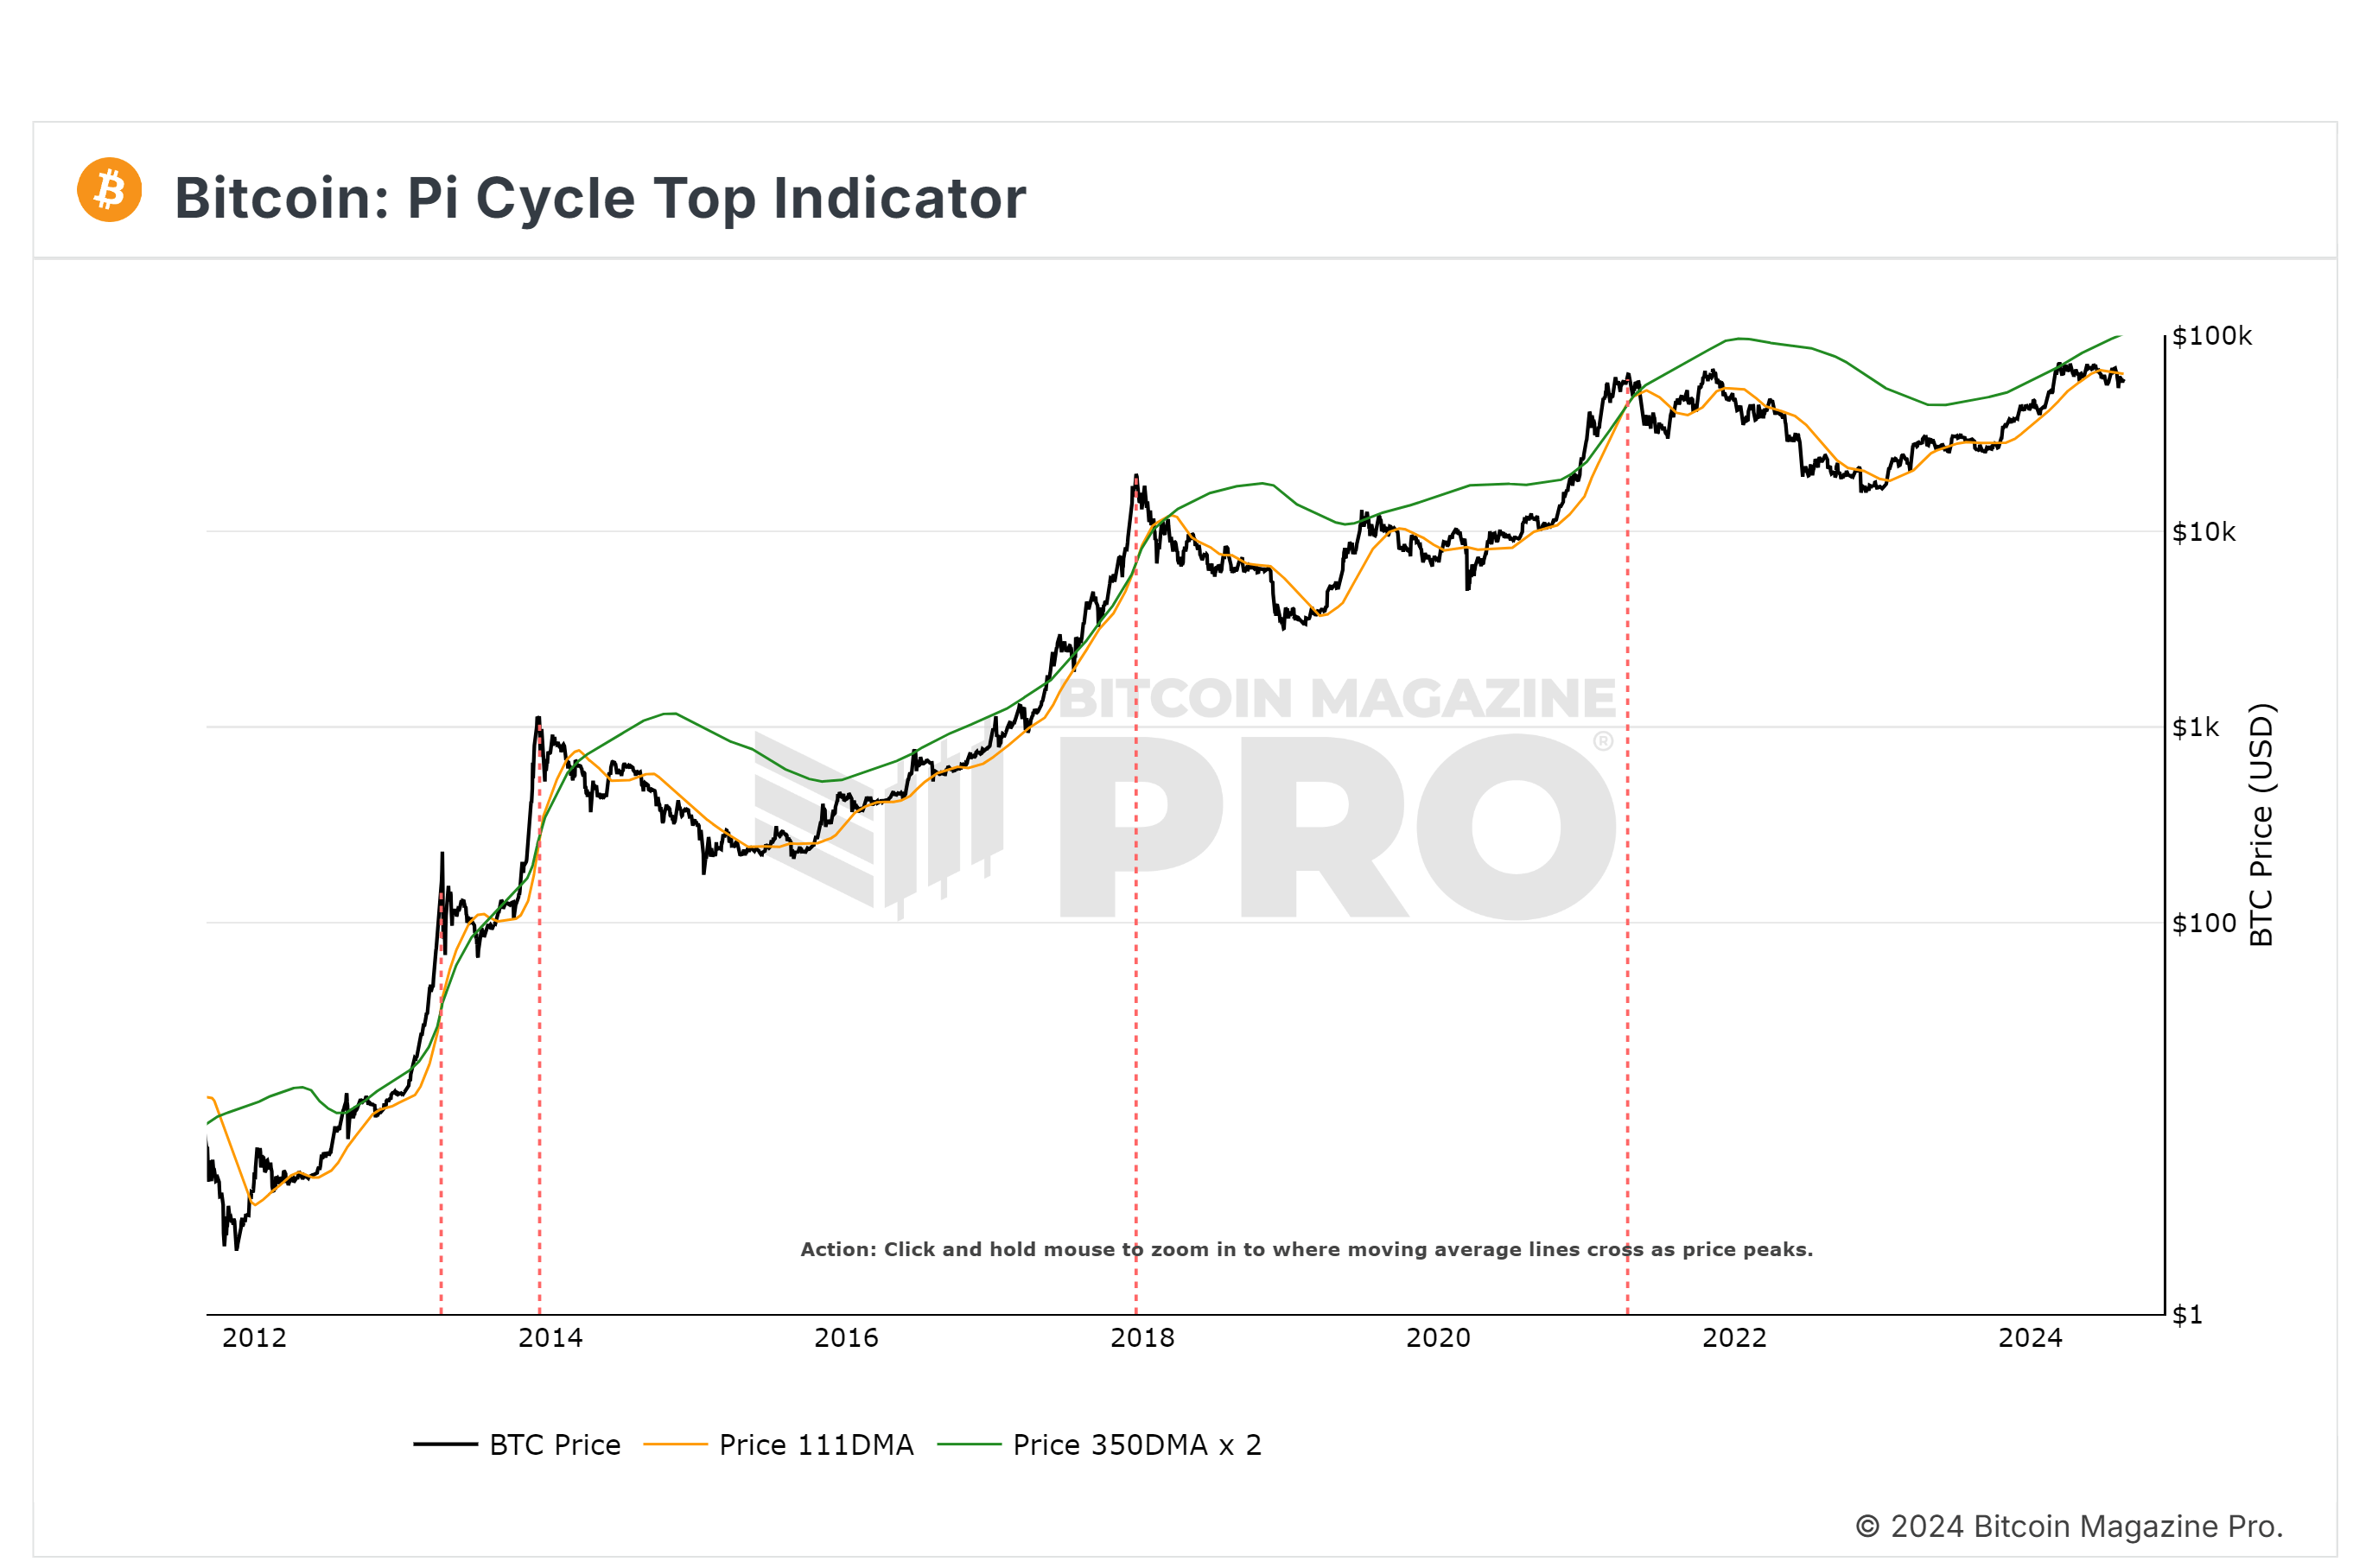
In a video update on YouTube, crypto analyst Rekt Capital delved into the dynamics of Bitcoin’s price movements through the lens of the PI Cycle Top Indicator, a predictive tool that has garnered attention for its historical accuracy in pinpointing the peaks of Bitcoin bull runs.
Here’s How High Bitcoin Price Could Go This Cycle
The PI Cycle Top Indicator operates by tracking two key moving averages: a short-term 111-day moving average (colored orange in Rekt Capital’s visual analysis) and the 350 day moving average (depicted in green) to gauge extended market trends. A crucial aspect of this tool is the “crossover” event where the short-term moving average rises above the long-term average, historically signaling a peak in Bitcoin’s bull market within a few days.

However, the current market data shows that these two moving averages are diverging rather than converging, suggesting that the conditions for a bull market peak are not yet in place. “As these two PI Cycle moving averages are currently diverging from one another, the bull market peak is nowhere close,” Rekt Capital explained in his video.
The 111-day moving average serves as a critical metric in Rekt Capital’s analysis. During bear market phases or pre-halving years, this moving average acts as a barometer for bargain buying opportunities, oscillating around it in downtrends. Conversely, in halving years, such as 2020, it tends to act as a support level, underpinning uptrends that lead to new all-time highs.
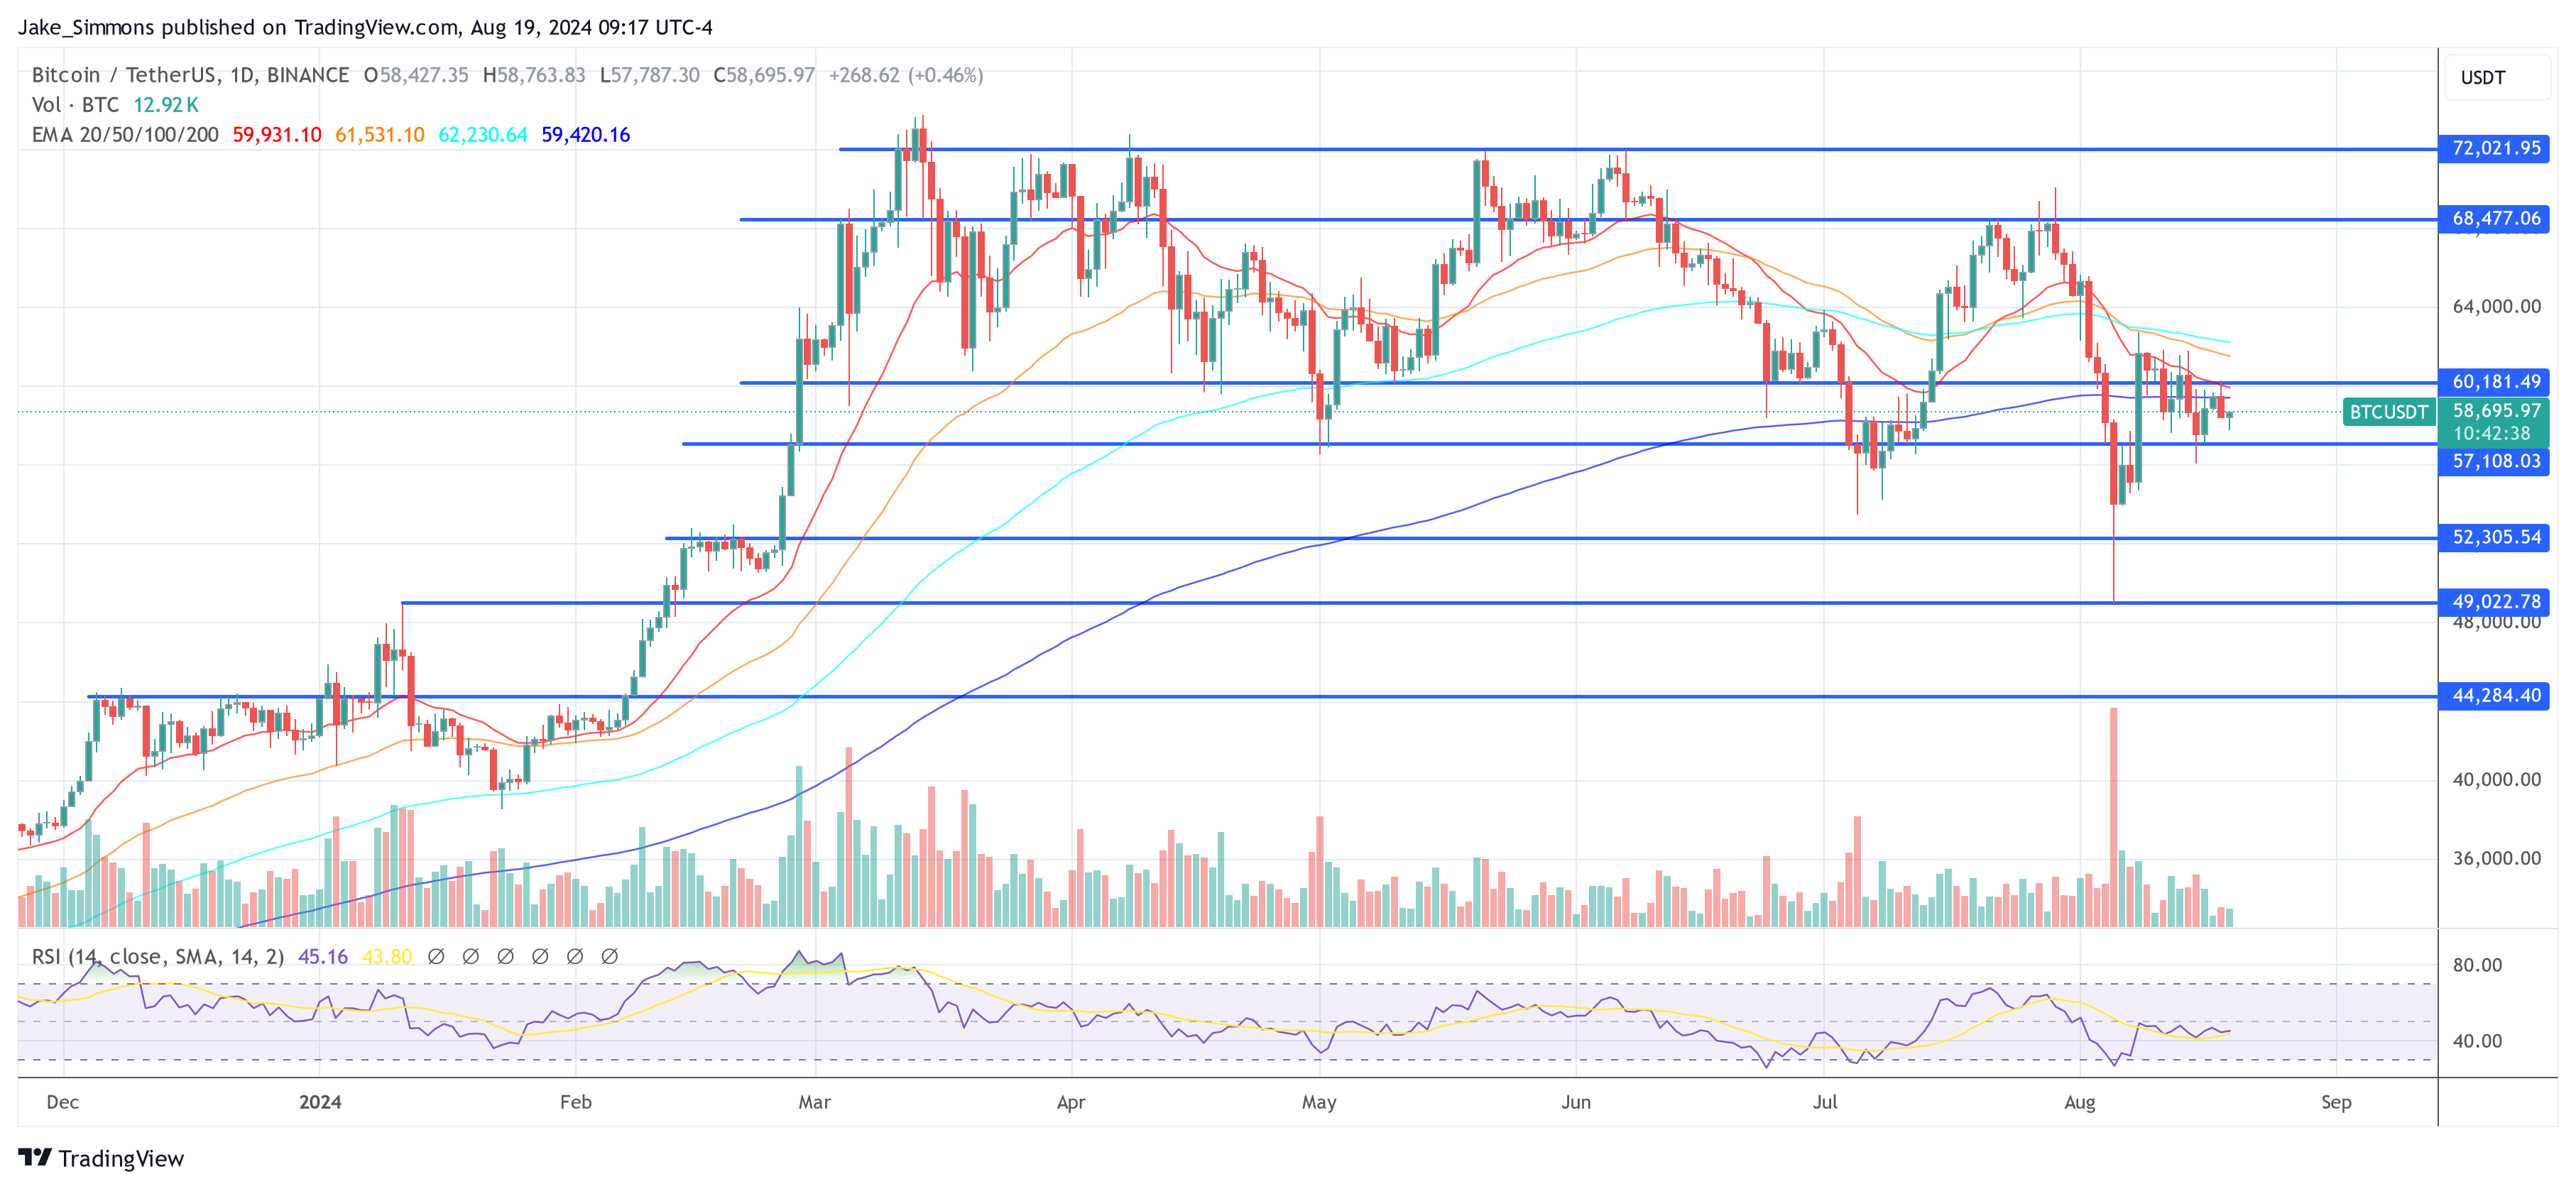
“Any dip below this moving average is a bargain buying territory,” Rekt Capital noted, emphasizing the strategic importance of this level during different market phases. Currently, Bitcoin is trading below this moving average, approximately at $59,000, which has not happened for a significant period since the pre-halving year, marking a potentially undervalued state relative to historical patterns.
The analysis suggests that if Bitcoin reclaims the $63,900 level—just above the current position of the 111-day moving average—it could end the current bargain buying opportunity, setting the stage for further upward movement. “We are approximately $5,000 away from reclaiming this region. Not much needs to happen for Bitcoin to bounce back and reclaim this region to end this bargain buying opportunity,” remarked Rekt Capital.
Another element of the PI Cycle Top Indicator is the 350 day moving average. This average typically gets revisited in later stages of the market cycle, often acting as resistance before an upside deviation occurs.
“Upside deviations beyond the green moving average that’s when we see parabolic price action take place,” Rekt Capital pointed out, referencing past events in 2013 and 2017 where such movements were observed. The current green moving average resides around $96,000, indicating a significant upside potential before any parabolic risks manifest.
Rekt Capital’s analysis suggests that while Bitcoin is far from reaching the $96,000 mark, historical patterns predict that it will eventually approach and possibly exceed this level, leading to a short-lived period of rapid price increase.
“[We are] nowhere close to this green moving average because it resides at around $96k, so we’re still almost $30k away from this region […] once we break beyond $96k we have to understand that the clock is starting to then start ticking really for the end of the ball run and we might have have a a window of just a few months where Bitcoin will be rallying uninterruptedly with of course pullbacks,” the analyst explained.
Looking ahead, Rekt Capital emphasized the importance of monitoring the convergence of these two moving averages for signs of a potential bull market peak. “We need to see a flick up in the Pi Cycle moving average for that crossover to be in place to some degree,” he stated, indicating that a sharp rise in price action is required for a definitive crossover to materialize.
At press time, BTC traded at $58,695.


