The post Bitcoin Looms Under $100k : A Bullish Momentum Is Coming appeared first on Coinpedia Fintech News
Bitcoin investors and traders are always trying to perfectly time the market movement, however it is not possible for all. The reason? Understanding and deciphering the market sentiments. Though there are many indicators that help in predicting the movement, most of them are delayed, that is why they are called lagging indicators. Let’s explore the possibility of when Bitcoin can reach $110k.
Exploring Bitcoin Chart
Before we talk about the sentiment side, let’s have a look at what is happening in Bitcoin right now.
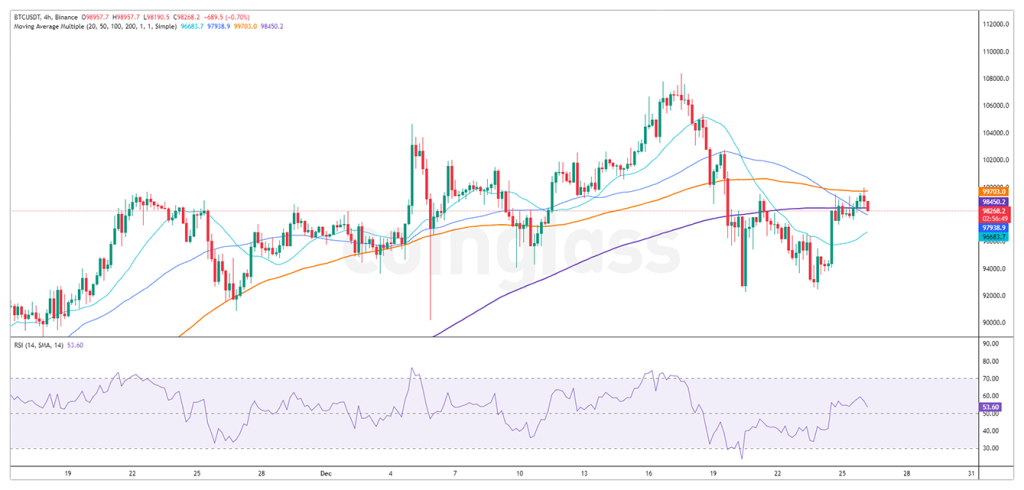
At the time of writing, Bitcoin is trading at $98,268, just 0.08% up as compared to the last 24 hours. The price rose as high as $99,950 a few hours ago but moving average 100 sent it back down. The current support is MA 200. Also this is a zone where previously BTC had faced high resistance so this will also act as support now.

The concern here is the RSI which is currently at 53.60 and constantly falling alongside price. The trading volume is down by 17.90% today as well. Even though the Fear and Greed Index was recorded at 79 which is extreme greed, the market sentiment feels bearish.
The Market Sentiment
The market intelligence platform Santiment shared deep insights in their X post. It has described how Bitcoin plays against market sentiments. On December 15, the social media was filled with speculations of BTC touching $110k, however it topped out at $108k, disappointing the market.
The same thing happened when the crypto was at $104k and there were mentions of it reaching $110k, it backed again.
If we analyse the history of Bitcoin movement and compare it with market sentiments, things go in the opposite direction of major market mentions. When the market gets filled with high bearishness, suddenly Bitcoin pumps and vice versa.
As people are again going super bullish and market sentiment is of greed, we should expect a price drop and not a rise. As soon as people stop expecting the market to rise it will shock them again.
Bitcoin Dominance and Exchange Reserves
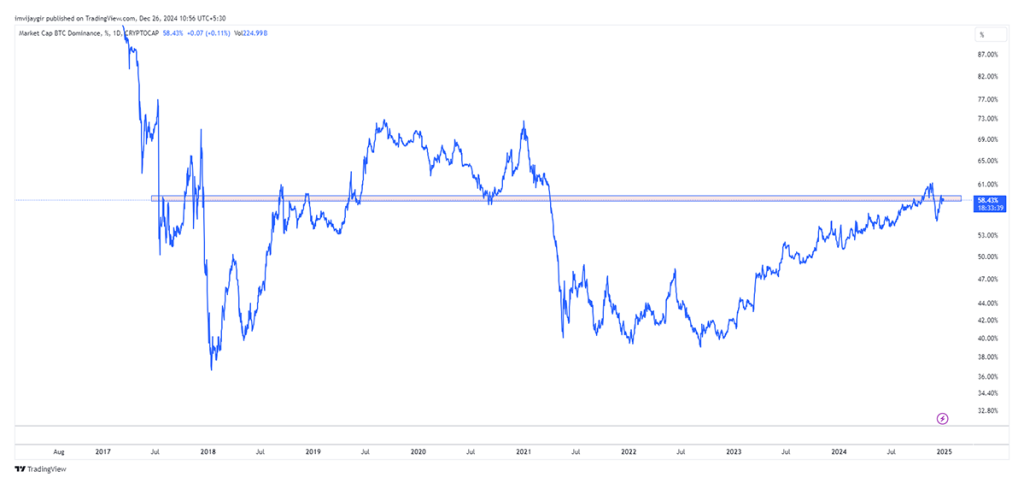
The market dominance of Bitcoin is at 58.43%. This means investors hold more Bitcoin than other cryptos. Historically, whenever BTC dominance fell below this point the price of BTC followed it, so this particular zone can be said to be a support zone. Currently we can see the price is falling however the dominance is rising, this means soon the money will start flowing out of alts and into the btc. But before that the price must take a correction and create a bearish market sentiment.

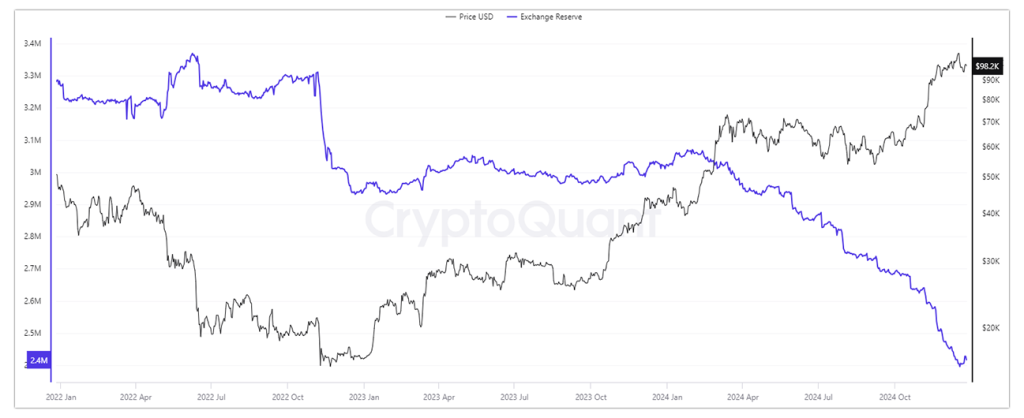
BTC exchange reserve data shows that since February 2024, the reserve has been falling and the price has been increasing. This metric shows how much Bitcoin is at the exchanges. A falling number shows that people are moving their crypto out of the crypto to a cold storage, giving a signal for a bullish momentum.

Zooming into the past few days we can see that the exchange reserves increased for a while. This happened because whales moved out their crypto to sell when the price was above $100k. Now, the downside curve is signaling an upcoming bullish movement again.
What to Expect?
From what we have already discussed, it should be pretty clear by now that the market moves against the market sentiment. Even though we can see the BTC reserve falling, the price is falling as well but the bitcoin market dominance is rising. This is a clear indication that the market is planning to catch traders by surprise. People will go bearish and open short trades, this is an opportunity for the big and smart traders to capture this money from the market and fill their bags. Nothing of this is financial advice but should be taken as an educational content.
So, are you bullish or bearish for Bitcoin?


 Bitcoin has jumped to as high as $99.8K on a bullish Christmas crypto performance. Traders are now swinging bullish once again, with speculation of $110K getting rampant. Historically, we will see $110K Bitcoin only after the crowd doesn't expect it, as this image shows.


