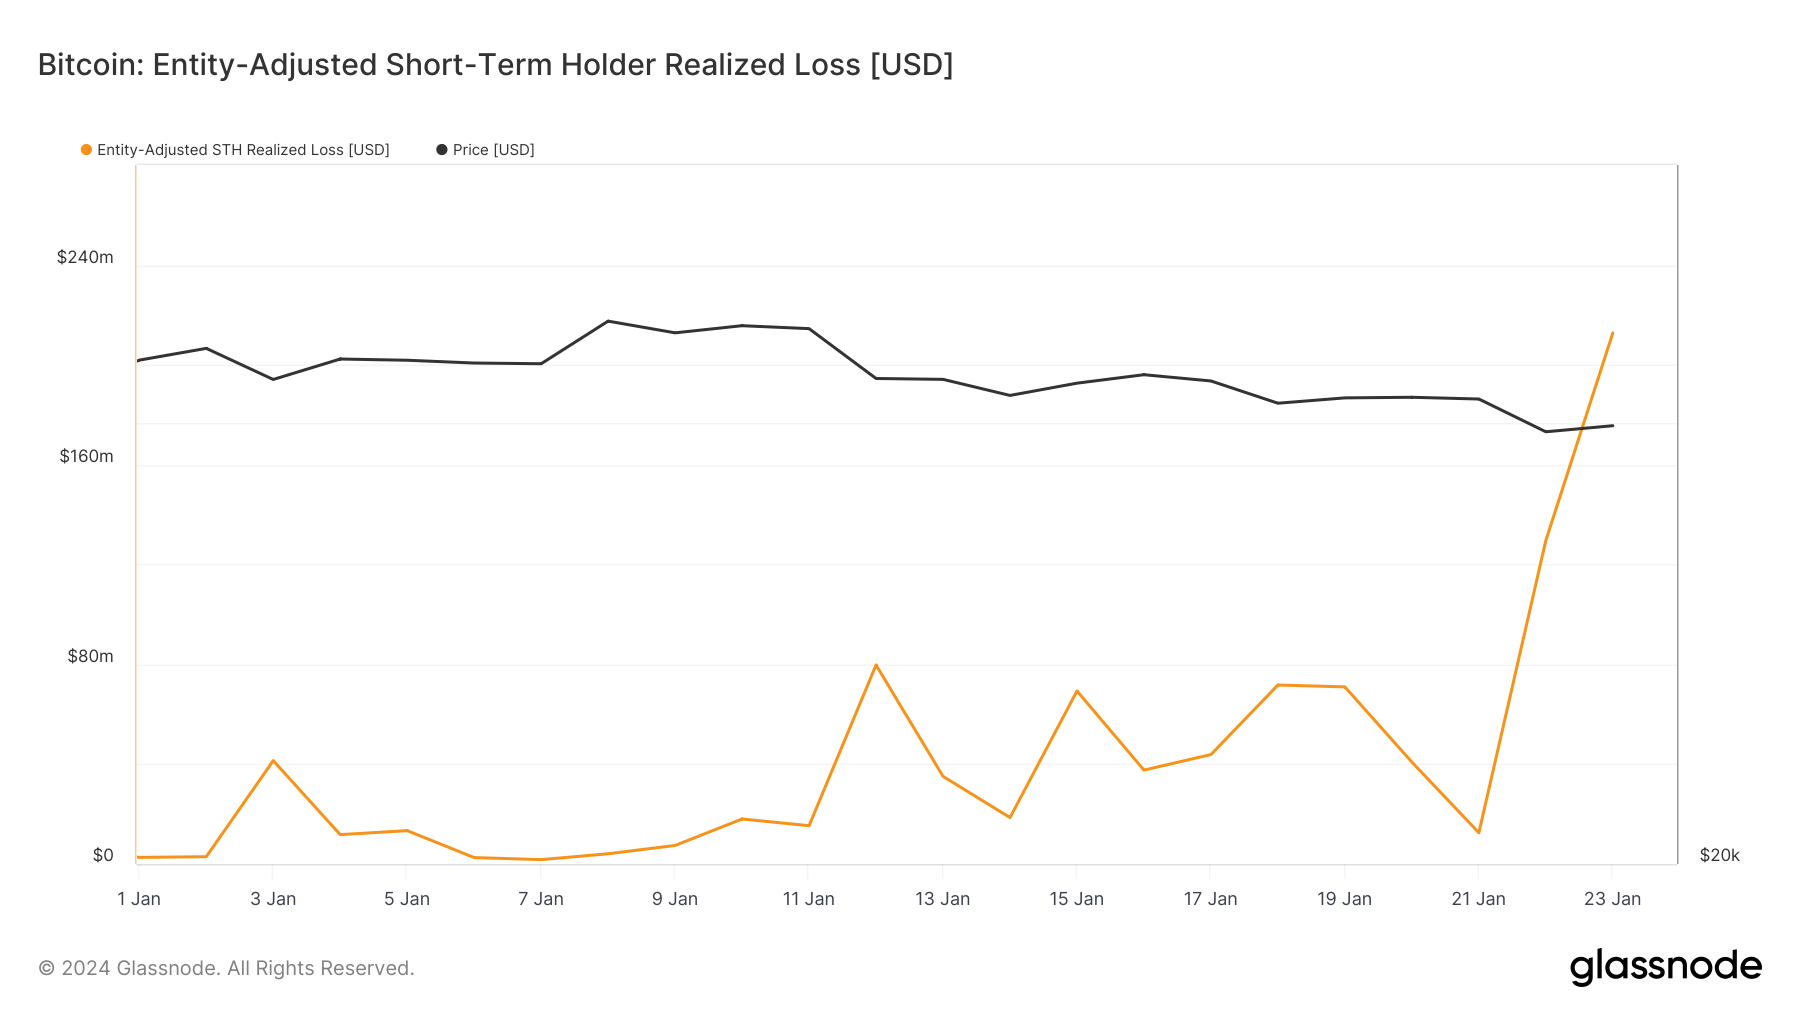
The volatility caused by the launch of spot Bitcoin ETFs in the U.S. has wiped over $115 billion off Bitcoin’s market cap. There has been a significant increase in realized losses in the week following the ETF launch, with short-term holders bearing the brunt of these losses.
Significant outflows from Grayscale’s GBTC have led to a sharp increase in over-the-counter (OTC) Bitcoin transfers, as redeeming GBTC for U.S. dollars requires GBTC to sell the underlying BTC OTC.
Short-term holders, sensitive to short-term volatility, had an aggressive reaction and began transferring their holdings to exchanges at a rapid pace. While a certain portion of short-term holders transferring to exchanges realized profits (i.e., sold their holdings at a price higher than when they bought them), most sold at a loss.
The pace of GBTC redemptions and short-term holder exodus to exchanges certainly affected Bitcoin’s price. BTC began losing its footing at $46,300 on Jan. 11, the first day of ETF trading and finally dropped below $40,000 on Jan. 22.
With $40,000 being a psychologically important level, BTC trading at $39,000 led to a seventeenfold increase in realized losses for short-term holders, with the cohort realizing $212.7 million in losses on Jan. 23, up from $129.5 million on Jan. 22, and $12.5 on Jan. 21.

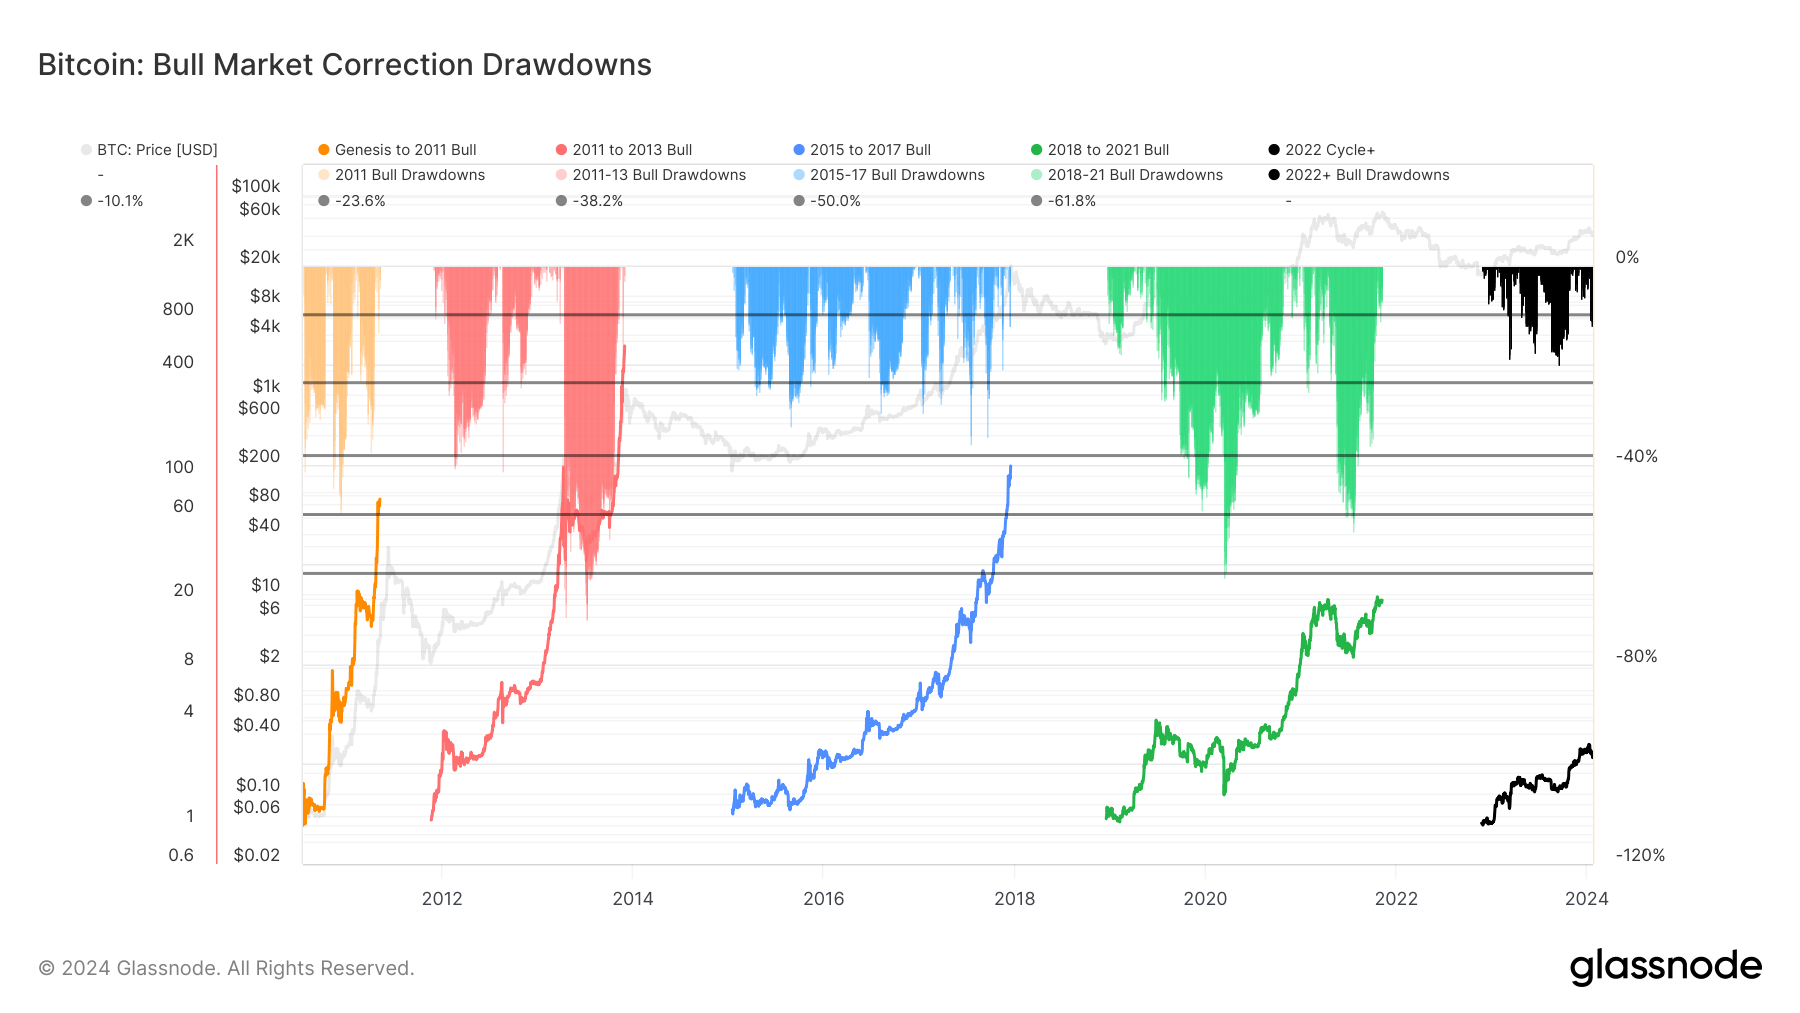
However, all of the selling pressure that seems to be originating from short-term holders, OTC desks, and other market participants trying to cut their losses has had a relatively small impact on Bitcoin’s price. While psychologically important, the drop below $40,000 still represents a small decline compared to previous cycle drawdowns. The 15% correction Bitcoin saw after ETFs began trading has been a regular occurrence in previous market cycles, with bull rallies experiencing drawdowns as high as 71%.

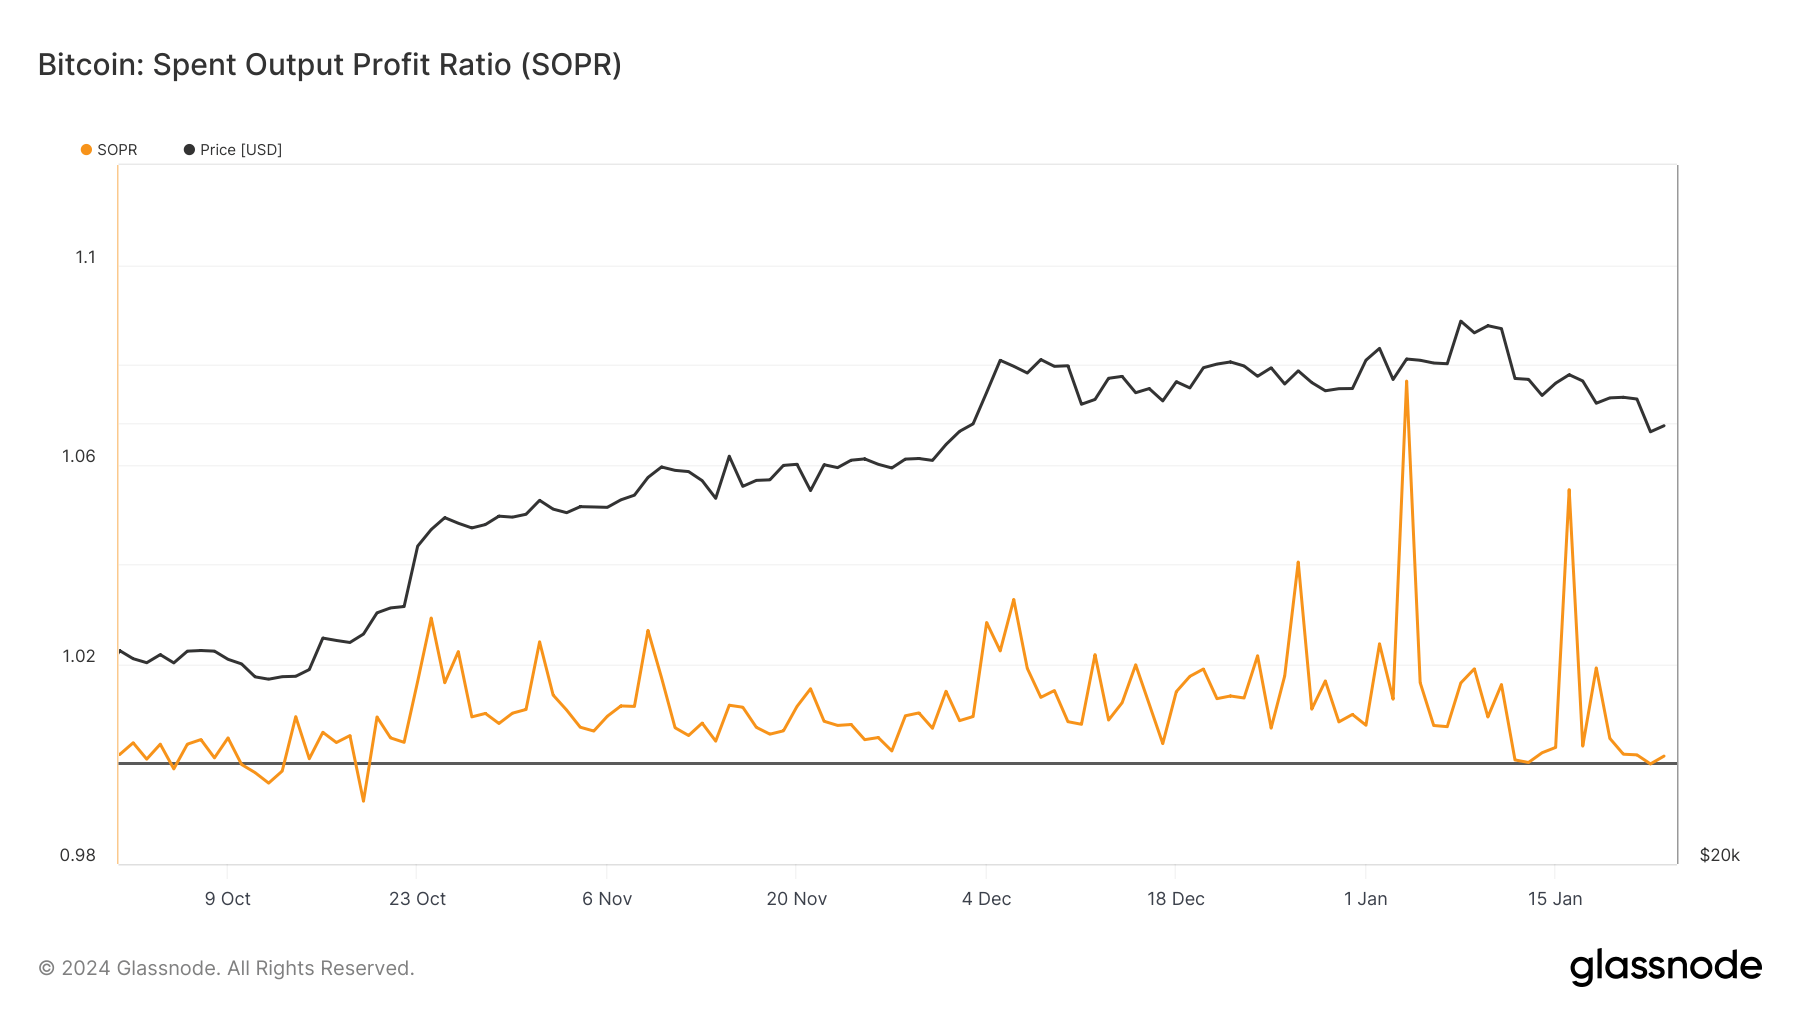
This price drawdown also seems to have had little impact on the overall bullish sentiment in the market. While this can be seen in various on-chain metrics, the spent output profit ratio (SOPR) emerges as the best indicator of the overall market sentiment. SOPR compares the value of spent outputs at the time of transaction to their value at creation, assessing whether Bitcoin holders are selling their coins at a profit or loss.
When SOPR is greater than 1, it shows that Bitcoin is, on average, being sold for a profit. Conversely, a SOPR below 1 implies that Bitcoin is being sold at a loss. A SOPR equal to 1 shows a neutral market where the average outputs are neither in profit nor loss.
Historically, SOPR values have been indicative of market tops and bottoms — very low SOPR values usually occur at market bottoms, where widespread selling at a loss leads to capitulation, which is usually followed by a market recovery.
Glassnode data analyzed by CryptoSlate shows that SOPR has consistently remained above one since Oct. 20, 2023. Bitcoin’s drop from $46,300 to $42,800 on Jan. 12 pushed it down significantly, but it still remained above 1. The drop to $39,000 also brought SOPR down but failed to push it below 1.

The market’s resilience can also be seen in the market value to realized value (MVRV) ratio. MVRV shows the ratio between Bitcoin’s market cap and realized cap. The realized cap represents the value at which each unit of Bitcoin last moved — essentially a sum of the value of all BTC at the price they were bought, ignoring those that haven’t moved.
The ratio can be used to identify periods where BTC is overvalued or undervalued relative to its “realized price,” helping mark market tops and bottoms. Like SOPR, an MVRV ratio higher than one shows the market price is higher than the realized price, and vice versa.
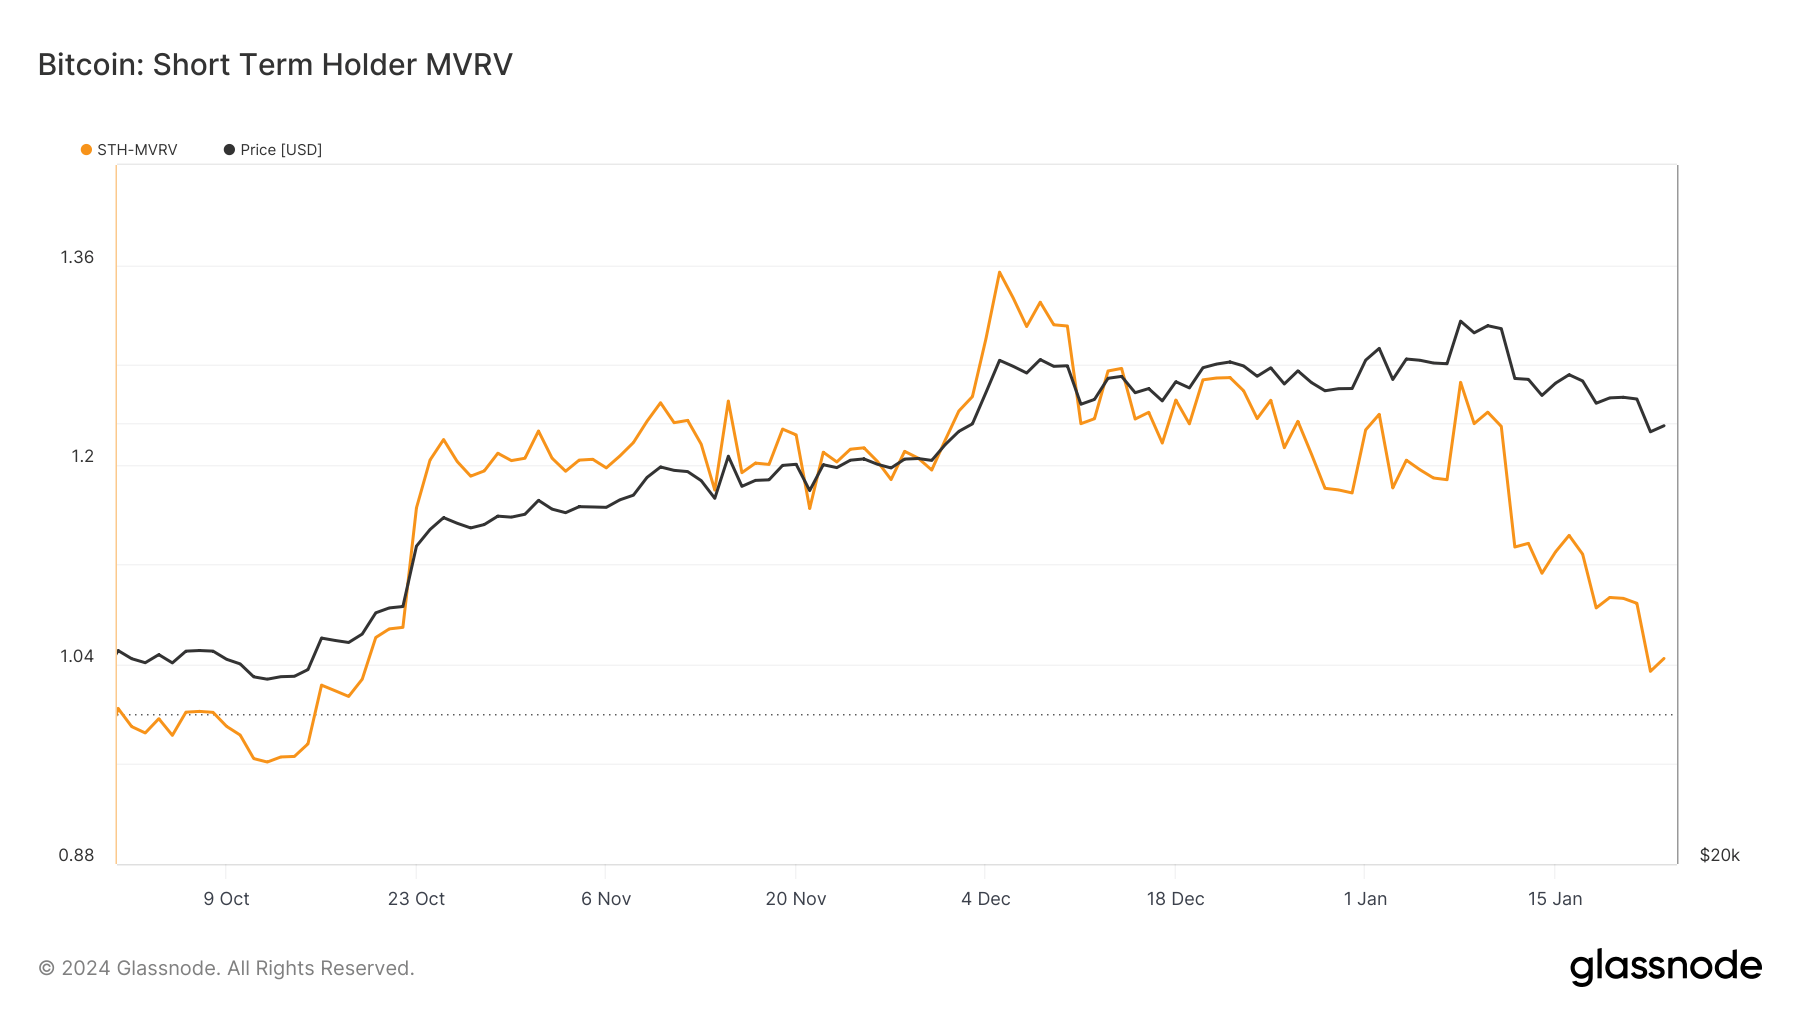
However, the MVRV ratio is more useful on longer timeframes, where it can be seen where long-term trends break or begin. As it doesn’t differentiate between the behavior of different cohorts, it becomes less valuable when analyzed in shorter timeframes. Short-term holder MVRV specifically targets the behavior of STHs, which are more reactive to market movements and can show immediate sentiment changes.
The STH MVRV has remained above one since Oct. 16, 2023, showing that Bitcoin’s market price has consistently been above short-term holders’ realized price despite the selling pressure. The drop below $40,000 pushed STH MVRV to a three-month low, but the ratio still remained above 1.

This shows that the selling pressure and the drop in price following the launch of Bitcoin ETFs haven’t fundamentally altered the bullish sentiment in the market. The market’s resilience is seen in the on-chain metrics like SOPR and MVRV, which currently show a market well-positioned to absorb shocks.
SOPR indicates that the market still hasn’t reached a point of capitulation, while STH MVRV shows that short-term holders haven’t reached the threshold of panic selling. The relative resilience of these ratios in the face of significant volatility shows the market now has a greater propensity to withstand short-term fluctuation.
CryptoSlate’s analysis of whale behavior further confirms the bullish sentiment in the market, as the heavy accumulation coming from the cohort is helping the market absorb the selling pressure even further.
The current state of the market can be seen as a consolidation phase, which is rather typical in Bitcoin’s cycles. The drawdown, while sharp and painful, is still in line with historical patterns of bull market corrections. Corrections like these have often served as a foundation for subsequent market recoveries.
The post The market is absorbing enormous selling pressure with little movement appeared first on CryptoSlate.


