The approval of spot Bitcoin ETFs in the US marked a significant milestone in the crypto market, symbolizing a triumph after years of regulatory hurdles and debates. The journey to approval was long and arduous, filled with concerns over market manipulation, liquidity, and investor protection. However, the eventual approval by the Securities and Exchange Commission (SEC) signaled a new era of mainstream acceptance of Bitcoin by the traditional financial market.
Just six months after trading began in the US, spot Bitcoin ETFs have emerged as a formidable force in the crypto market. These ETFs have rapidly accumulated substantial holdings, now possessing over $50 billion as of July 2024. This growth has made them the fastest-growing ETFs ever launched in the US, perfectly illustrating their immense appeal to both retail and institutional investors.
Their rapid rise hasn’t only increased the credibility and accessibility of BTC — it has also introduced a new dimension to the crypto market and investor behavior. Understanding the flows and balances of these ETFs is now crucial for understanding the crypto market.
Six months have passed since the launch of spot Bitcoin ETFs in the US, making it a perfect time to draw a line and analyze the trends we’ve seen in the year’s first half.
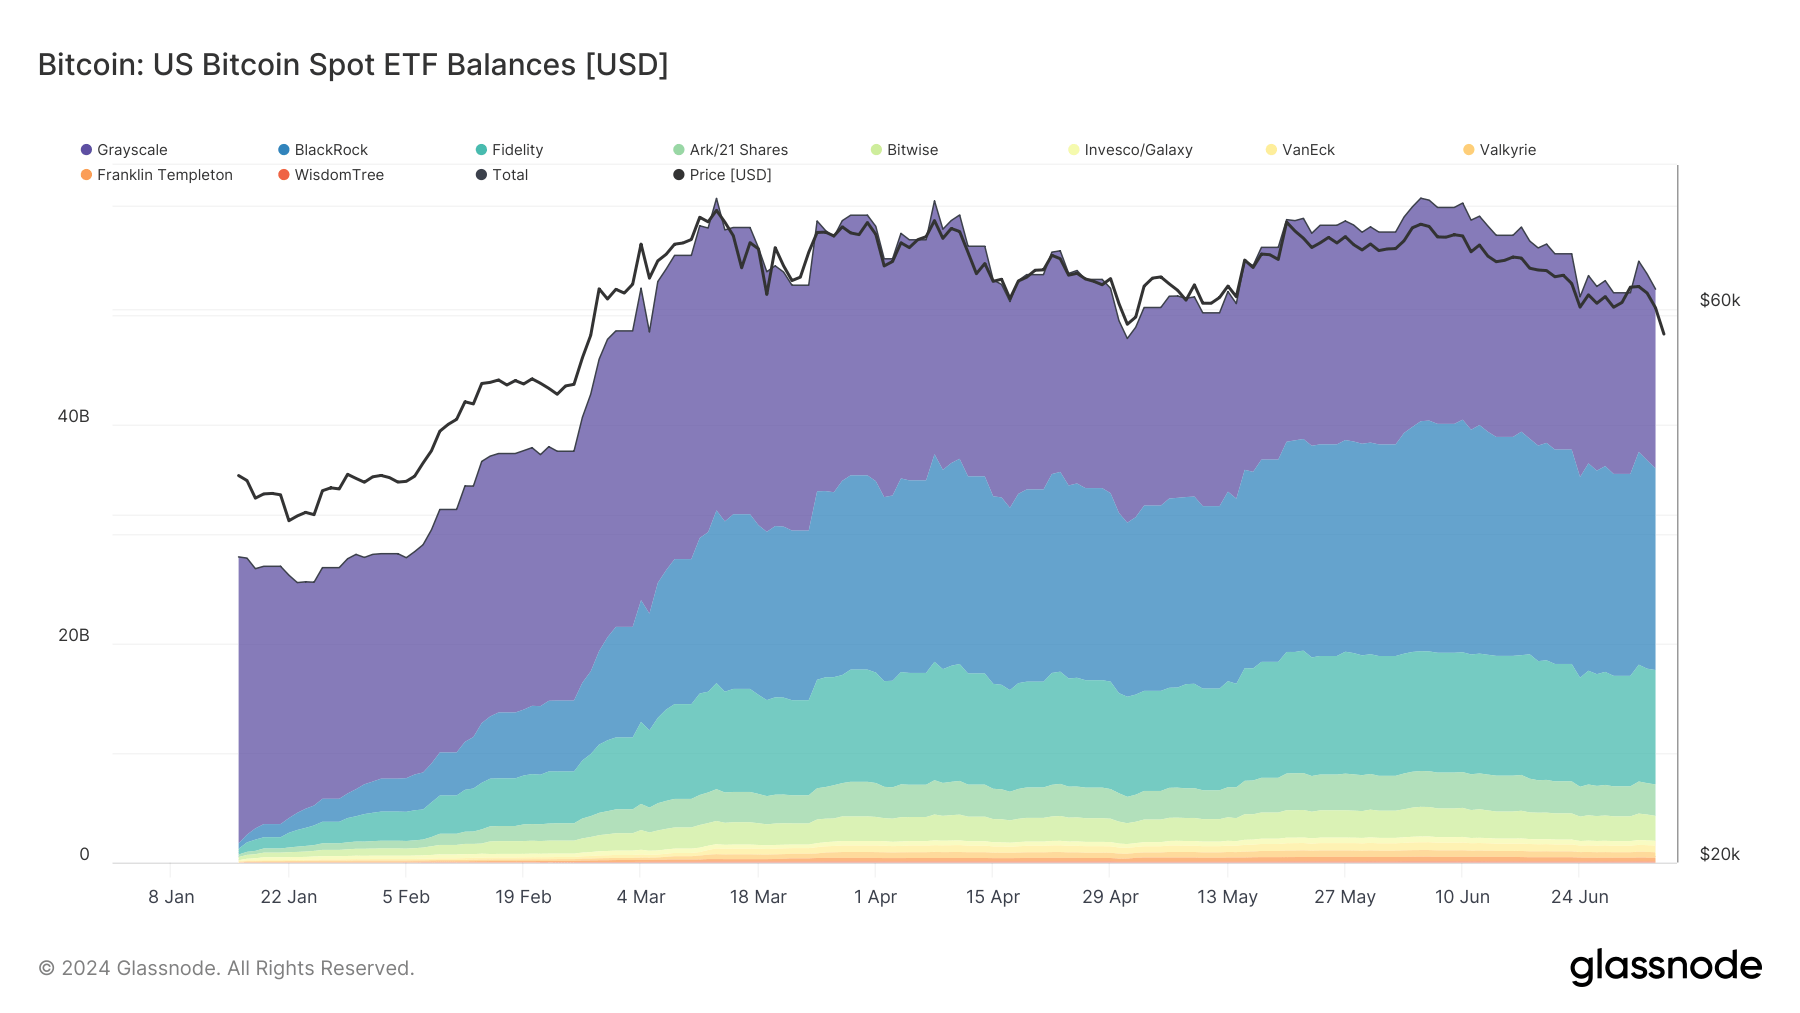
Looking at the broader picture, we see that the balance of Bitcoin ETFs showed a general increasing trend from January to June. The total balance started at approximately $27.89 billion in mid-January and fluctuated, reaching peaks and troughs but settling at over $52 billion by the beginning of July.
Grayscale’s GBTC held the largest balance among the ETFs, starting at over $26 billion. However, GBTC lost its dominant position at the end of May, when BlackRock’s IBIT surpassed it as the ETF with the highest balance. Fidelity’s Bitcoin Trust showed immense growth, beginning the year with balances around $517 million and entering July with over $10 billion.
Most ETFs showed growth throughout the first half of the year. However, the market saw periods of high volatility and investor activity, leading to significant balance fluctuations. The larger the balances, the higher the volatility, with ETFs with smaller balances showing significantly less volatility during the year.

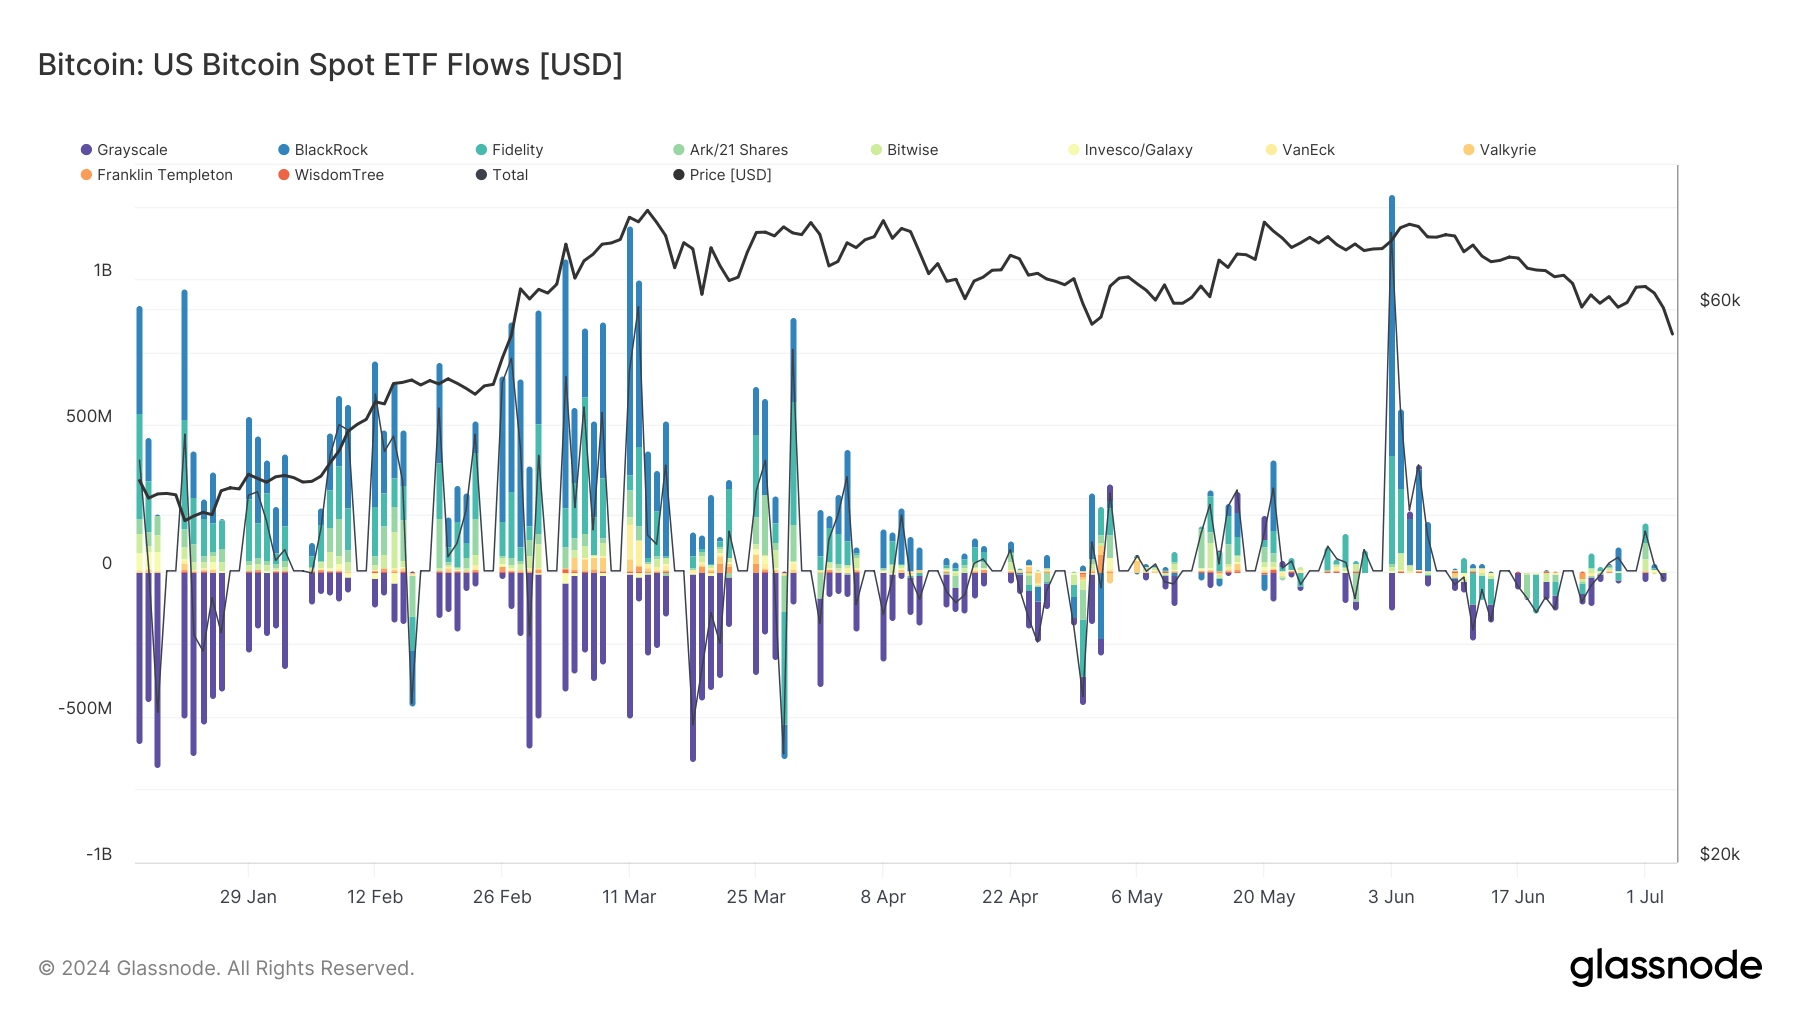
Analyzing flows helps us get a more granular view of how the market trades. The early part of the year saw substantial inflows, benefiting from a positive market momentum and investor confidence. This strong inflow momentum lasted well into March, with BlackRock’s IBIT seeing the highest rate of inflows among all ETFs. As the second quarter of the year began, the market saw a notable decrease in inflows. This was most likely driven by several factors, with Bitcoin’s price consolidation at around $62,000 being the main driver.
The first quarter of the year was also characterized by massive outflows from GBTC, which exceeded $672 million in the second half of January. High outflows, often exceeding $200 million, continued until the second quarter when the relative calmness of the market also seemed to have subdued the outflows.
In June, the market seemed to have awakened a new appetite for ETFs. However, the appetite appears to have been reserved only for BlackRock’s ETF, as IBIT saw over $894 million in inflows on June 3. The sharp burst in inflows most likely exhausted the market, which saw modest activity throughout the month and entered July with unremarkable numbers.

The post Spot Bitcoin ETFs six months on – explosive growth, reshaping investor landscapes appeared first on CryptoSlate.


